监控方案
- 起因
- 服务疑似间歇性无法访问。预计问题的原因很多,如:机房网络间歇性故障或服务器处理流量瓶颈导致超时。
- 方案:
- 对特定url指定频率进行访问,根据响应非200code告警;同时记录服务器时序性负载、网络、cpu、内存、磁盘等重要数据。做后期分析,找到服务间歇性无法访问的原因。
工具的选用、工具提供的功能和数据
| 名称 |
作用 |
数据 |
| Prometheus |
收集监控目标的时序数据 |
默认有prometheus服务相关数据 |
| Blackbox_exporter |
这里主要用来对http或https的地址做探测 |
提供对每次url请求后响应码 |
| Node_exporter |
收集服务器内核相关的数据 |
重点关注收集的cpu(cpu相关数据)、diskstats(磁盘统计数据)、loadavg(系统负载数据、meminfo(内存信息)、netstat (网络连接信息)、softnet(软连接)等 |
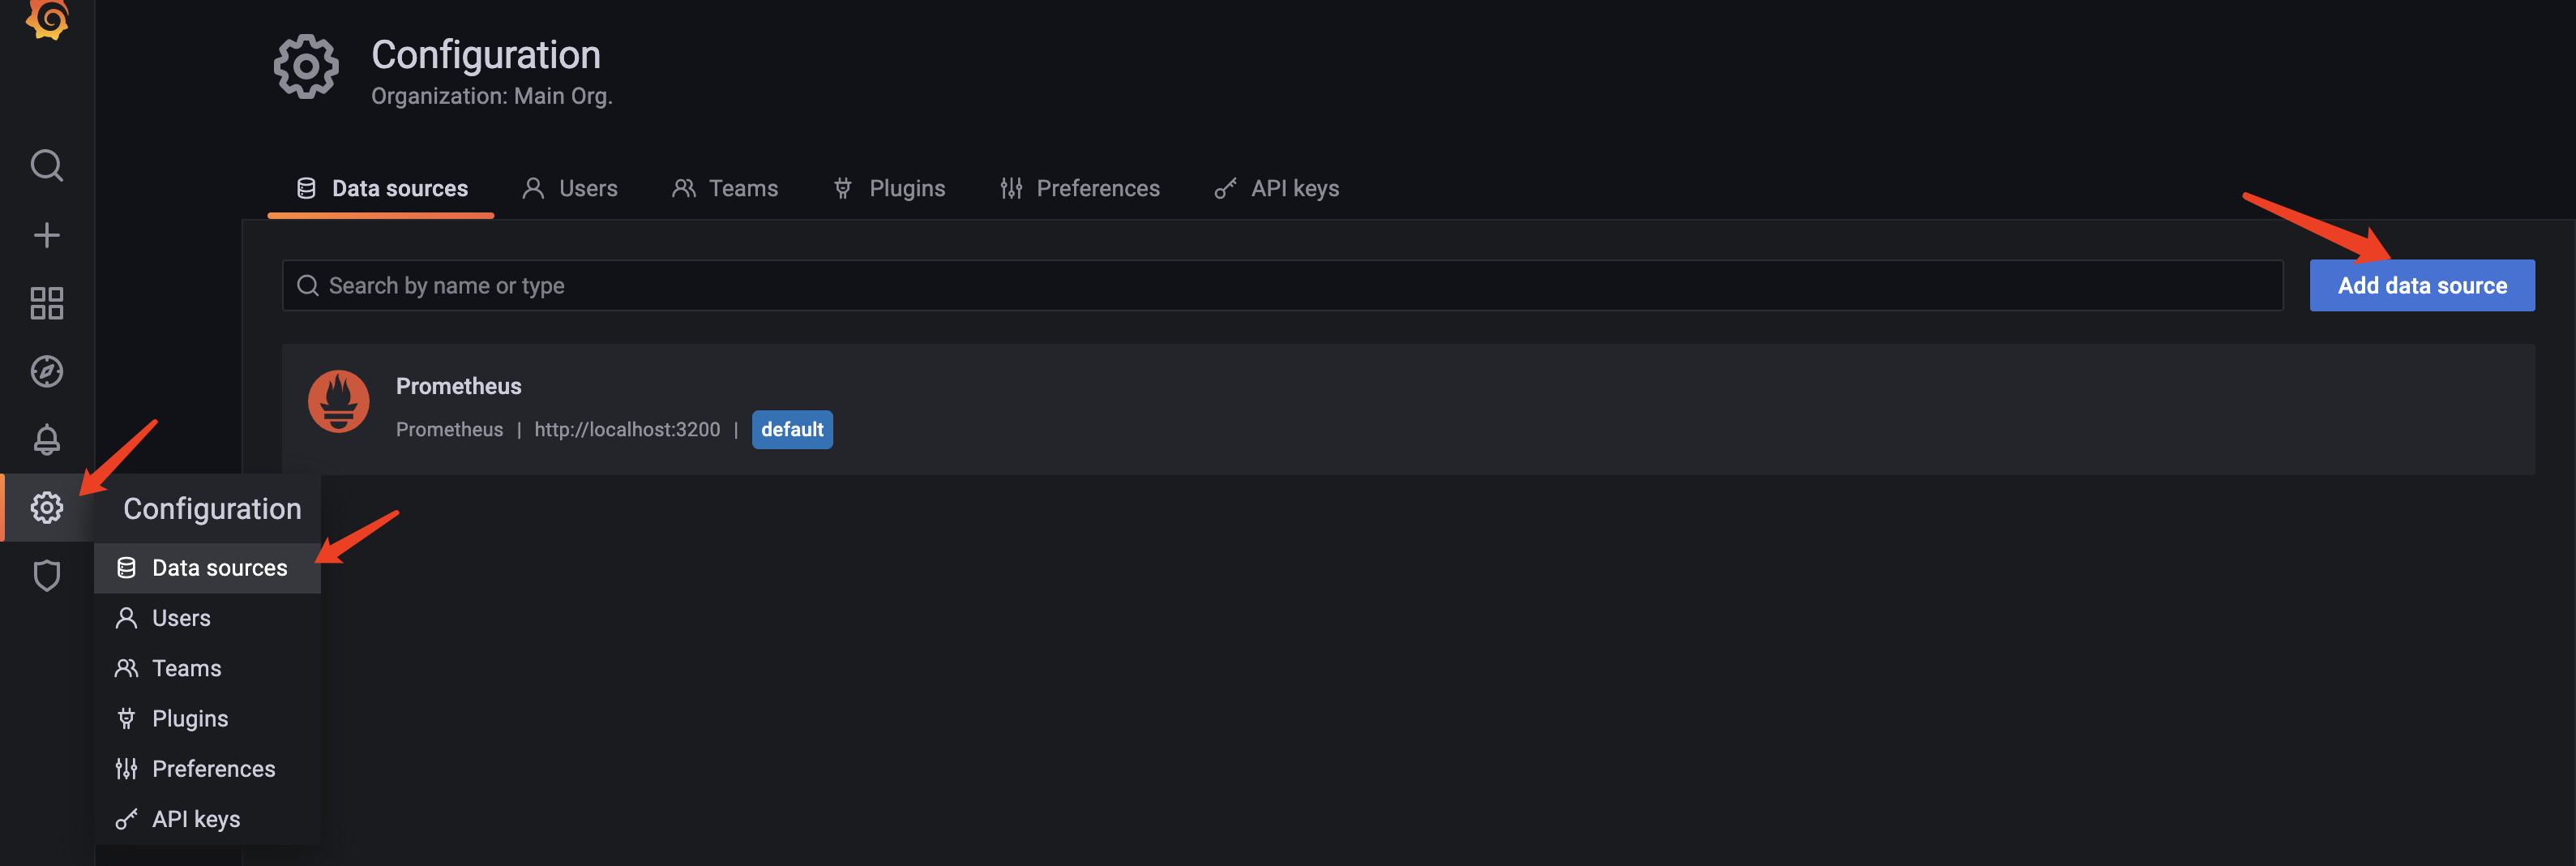
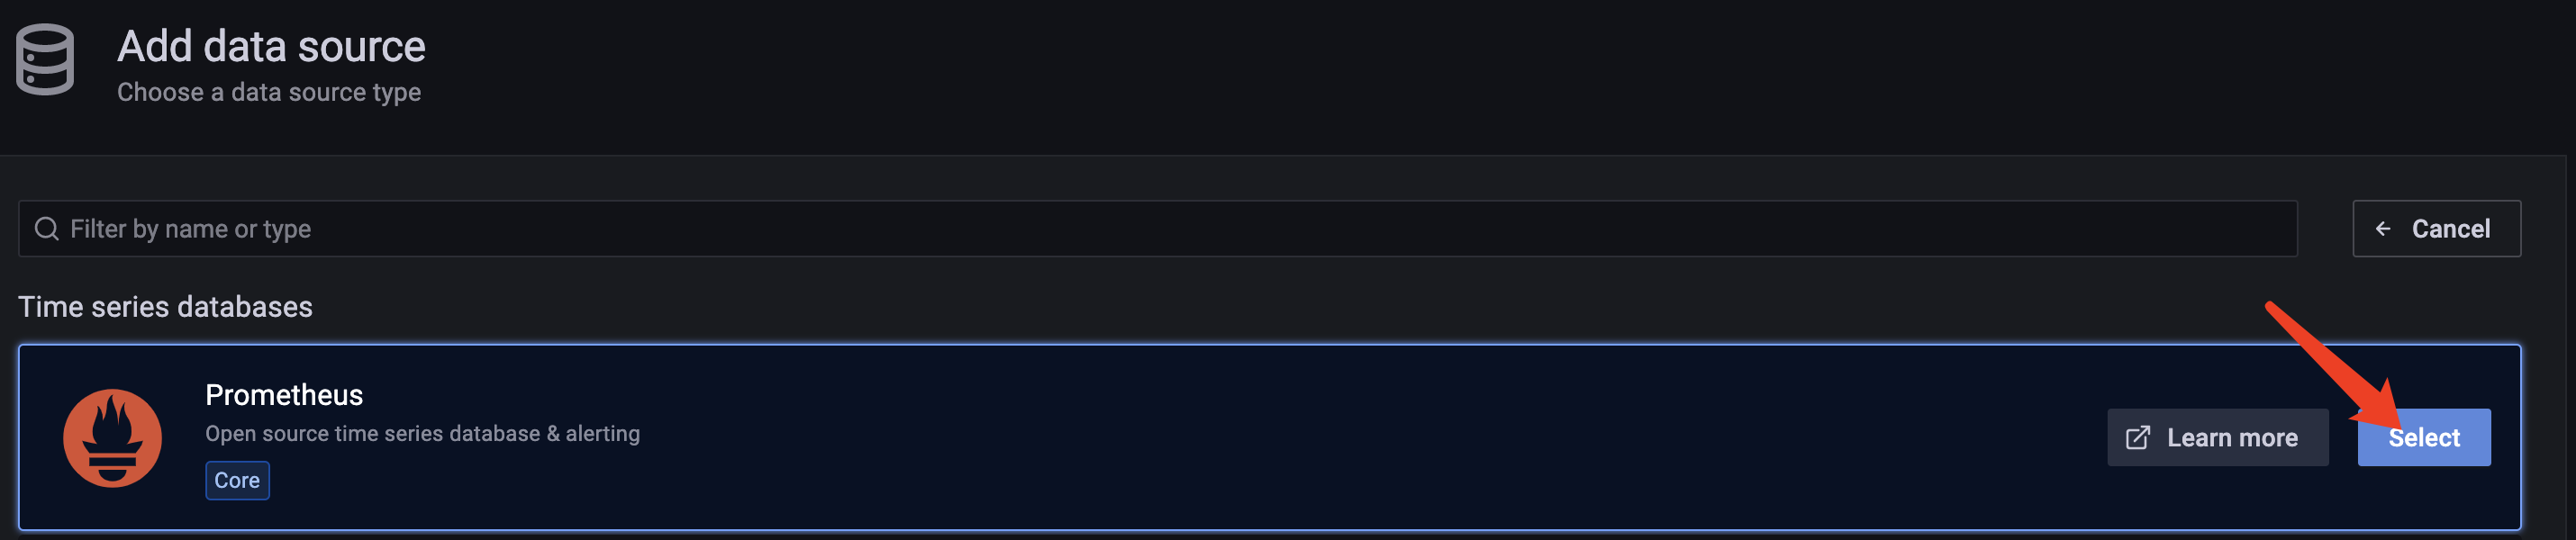
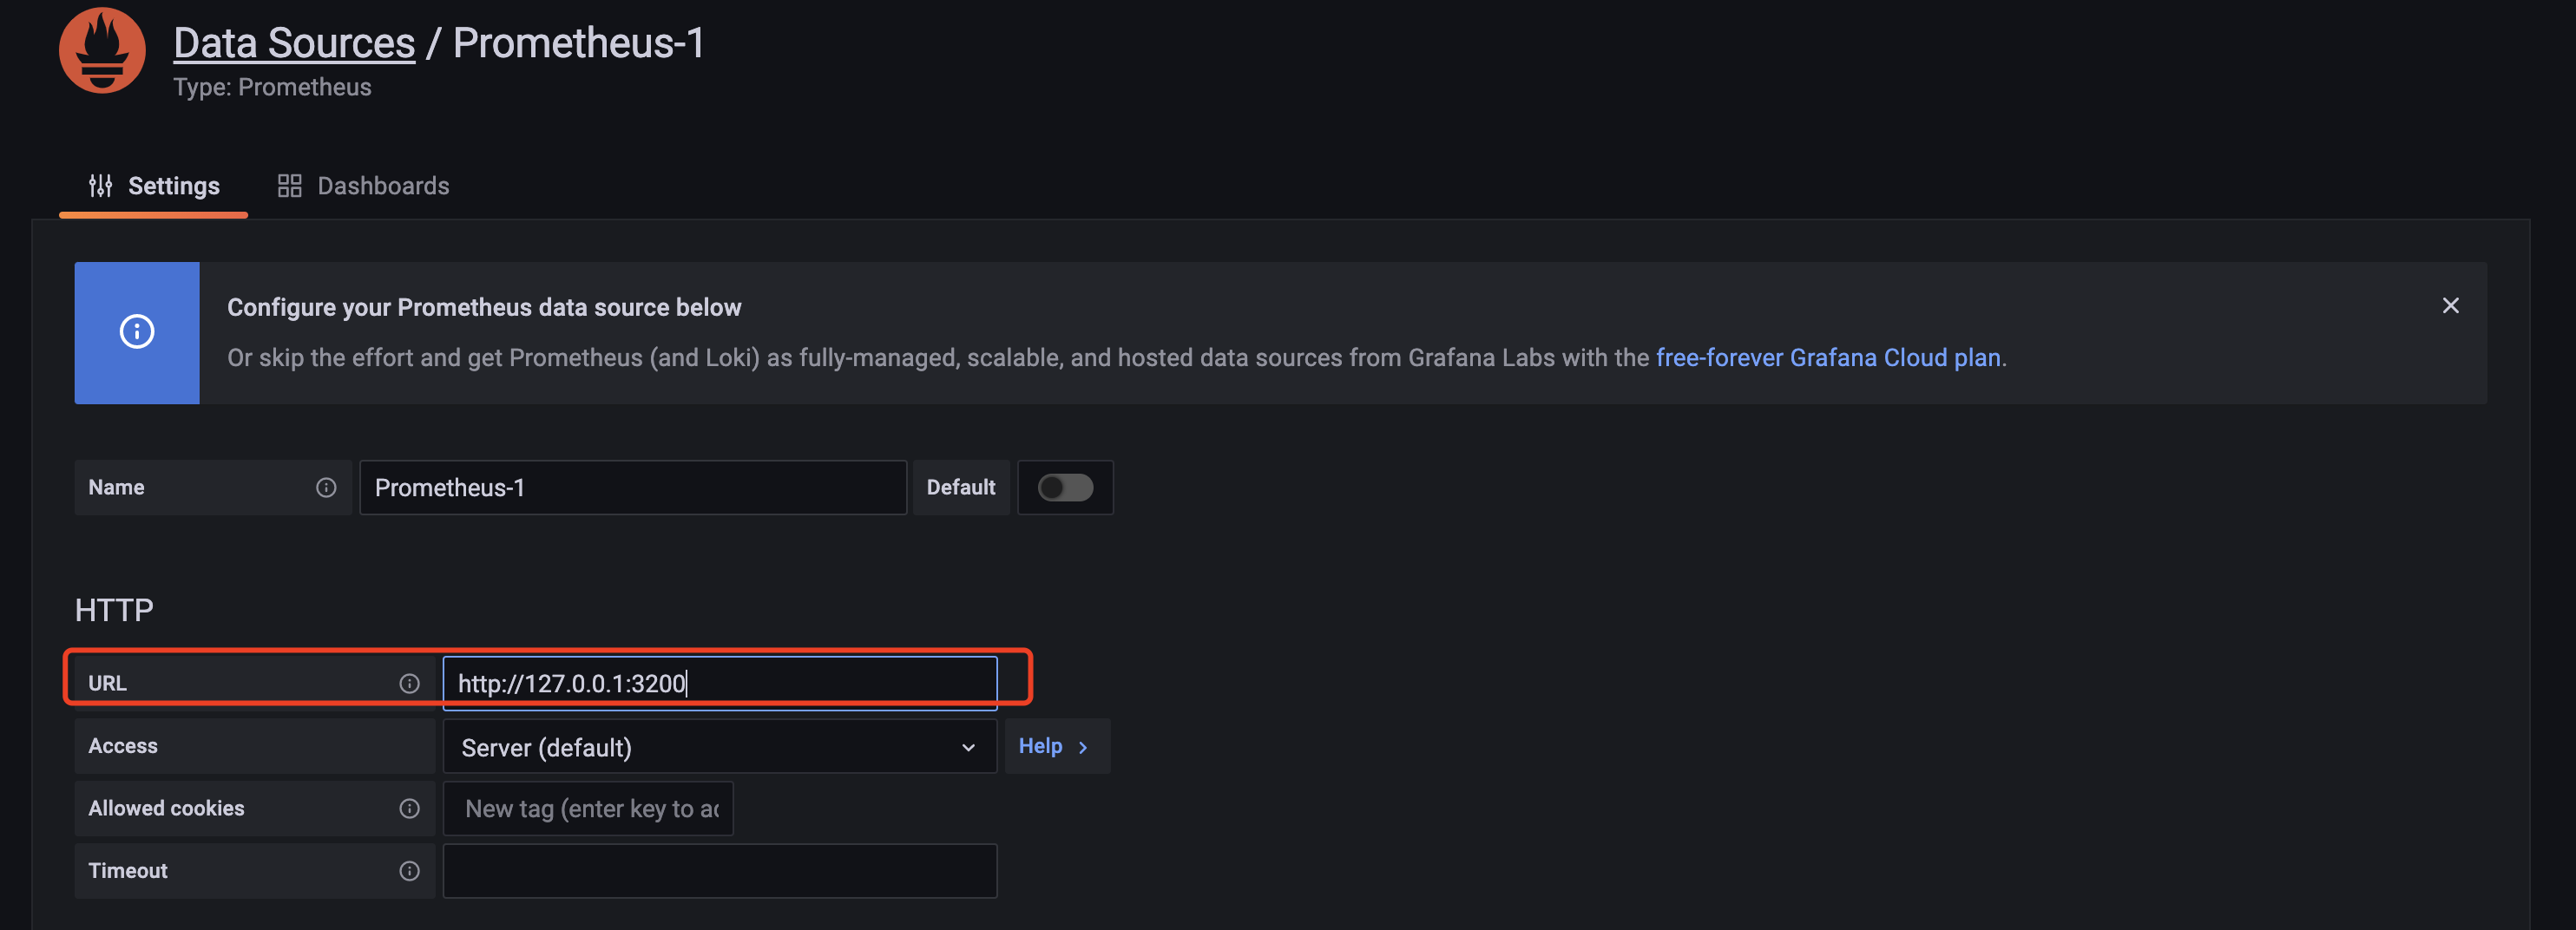
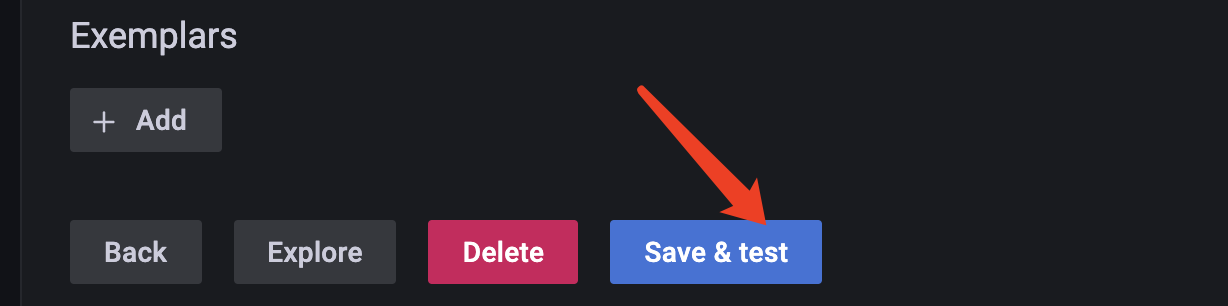
| Grafana |
对prometheus收集的数据绘图:方便分析、设置预警 |
提供图像、alert(报警) |
工具安装配置
cd /opt
mkdir prometheus node_exporter blackbox grafana monitor

# Prometheus
cd prometheus
wget https://github.com/prometheus/prometheus/releases/download/v2.30.3/prometheus-2.30.3.linux-amd64.tar.gz
tar xf prometheus-2.30.3.linux-amd64.tar.gz
ln -s /opt/prometheus/prometheus-2.30.3.linux-amd64 /opt/monitor/prometheus

# blackbox exporter
cd ../blackbox
wget https://github.com/prometheus/blackbox_exporter/releases/download/v0.19.0/blackbox_exporter-0.19.0.linux-amd64.tar.gz
tar xf blackbox_exporter-0.19.0.linux-amd64.tar.gz
ln -s /opt/blackbox/blackbox_exporter-0.19.0.linux-amd64 /opt/monitor/blackbox_exporter

# Node_exporter
cd ../node_exporter
wget https://github.com/prometheus/node_exporter/releases/download/v1.2.2/node_exporter-1.2.2.linux-amd64.tar.gz
tar xf node_exporter-1.2.2.linux-amd64.tar.gz
ln -s /opt/node_exporter/node_exporter-1.2.2.linux-amd64 /opt/monitor/node_exporter

# Grafana
cd ../grafana
wget https://dl.grafana.com/enterprise/release/grafana-enterprise-8.2.1.linux-amd64.tar.gz
tar xf grafana-enterprise-8.2.1.linux-amd64.tar.gz
ln -s /opt/grafana/grafana-8.2.1 /opt/monitor/grafana
########## Prometheus : /opt/monitor/prometheus/prometheus.yml
# Here it's Prometheus itself.
scrape_configs:
  # The job name is added as a label `job=<job_name>` to any timeseries scraped from this config.
  - job_name: "prometheus"

    # metrics_path defaults to '/metrics'
    # scheme defaults to 'http'.

    static_configs:
      - targets: ["localhost:3200"]
  - job_name: 'urlCheck'
    metrics_path: /probe
    params:
      module: [http_2xx_check]  # Look for a HTTP 200 response.
    static_configs:
      - targets:
        - http://admin.dajxyl.com/privacy/index.html
    relabel_configs:
      - source_labels: [__address__]
        target_label: __param_target
      - source_labels: [__param_target]
        target_label: instance
      - target_label: __address__
        replacement: 127.0.0.1:9115  # The blackbox exporter's real hostname:port.
  - job_name: 'hostInfo'
    static_configs:
      - targets: ['127.0.0.1:9100']
  - job_name: 'alertmanager'
    static_configs:
      - targets: ['127.0.0.1:9003']
########## blackbox exporter: /opt/monitor/blackbox_exporter/blackbox.yml
modules:
  http_2xx_check:
    prober: http
    timeout: 5s
    http:
      method: GET
      headers:
        Host: admin.dajxyl.com
      no_follow_redirects: true
      fail_if_ssl: false
      fail_if_not_ssl: false
      fail_if_body_matches_regexp:
        - "timeout"
########## Grafana:/opt/monitor/grafana/conf/defaults.ini
# The http port to use
http_port = 3300
[smtp]
enabled = true
host = smtp.163.com:465
user = 15775973132@163.com
password = xxxxxxx
from_address = 15775973132@163.com
from_name = Grafana
ehlo_identity = dashboard.example.com
#!/bin/bash
pPath=/opt/monitor
#ps=(alertmanager  blackbox_exporter  grafana  node_exporter  prometheus  pushgateway)

# blackbox_exporter
cd $pPath/blackbox_exporter
nohup ./blackbox_exporter --config.file=./blackbox.yml  --web.listen-address="127.0.0.1:9115" > nohup.out 2>&1 &

# node_exporter
cd $pPath/node_exporter
nohup ./node_exporter --web.listen-address="127.0.0.1:9100" > nohup.out 2>&1 &

# prometheus
cd $pPath/prometheus
nohup ./prometheus --config.file=./prometheus.yml --web.listen-address='127.0.0.1:3200' > nohup.out 2>&1 &

# alertmanager
#cd $pPath/alertmanager
#nohup ./alertmanager --config.file="./alertmanager.yml" > nohup.out 2>&1 &

# grafana
cd $pPath/grafana
nohup ./bin/grafana-server -config=./conf/defaults.ini > nohup.log 2>&1 &